Executive Summary
The Kenya Health Facilities Dashboard is a healthcare planning application that integrates multiple public datasets into a structured county-level analytical workflow. Rather than presenting healthcare facility records in isolation, the project combines health facility data, county population statistics, and KDHS 2022 health indicators to support transparent county comparison, population-adjusted access analysis, and exploratory healthcare planning.
The project evolved through multiple releases from a facility distribution dashboard into a production-ready planning application that introduced population-adjusted healthcare access, county comparison workflows, Planning Priority and Health Need methodologies, public API access, and production-quality frontend engineering. By integrating multiple public datasets into a unified analytical model, the platform provides planning context that cannot be obtained from any individual dataset alone.
The final production release includes a React frontend deployed on Vercel, a FastAPI backend deployed on Render, publicly documented REST APIs, production-ready performance optimisation, accessibility improvements, and transparent analytical methodologies designed to support structured county-level planning and review.
date: "2026-07-18" year: "2026"
client: "Independent Project"
Release
V5.0.0
Production portfolio release
Deployment
Production
React frontend, FastAPI backend, and public API
Architecture
Full Stack
Interactive dashboard with documented REST API
Context
Healthcare planning requires more than knowing where facilities are located. Planners must understand how healthcare access varies relative to population size, how service availability differs across regions, how ownership patterns influence local service delivery, and where underlying health needs are greatest. These factors collectively shape decisions about resource allocation, service expansion, and long-term health system planning.
Many public health datasets provide valuable information individually, but they are often published separately and answer only part of the planning problem. Health facility records describe healthcare infrastructure, population statistics provide demographic context, and household survey indicators highlight patterns of health need. Viewed independently, each dataset offers only a partial understanding of county-level healthcare systems.
This project explores how these independent public datasets can be integrated into a single analytical workflow. By combining health facility records, county population statistics, and KDHS 2022 indicators, the platform enables population-adjusted access analysis, transparent planning methodologies, and structured county comparison within a unified planning application.
Rather than treating each dataset as a standalone source of information, the project demonstrates how integrating them produces planning signals and analytical context that no individual dataset can provide on its own. This integrated perspective allows counties to be compared more consistently while providing a stronger foundation for exploratory analysis and evidence-informed discussion.
Problem
Public healthcare datasets contain valuable information, but they are rarely structured to answer planning questions directly. Health facility records describe healthcare infrastructure, population statistics provide demographic context, and household survey indicators highlight patterns of health need. Individually, these datasets answer different questions, making it difficult to develop a consistent understanding of healthcare access across counties.
This fragmentation creates practical challenges for healthcare planning. A county with a relatively large number of facilities may still have limited healthcare access when population size is considered. Another county may appear well served but rely heavily on a single ownership sector or exhibit greater underlying health needs based on maternal health, family planning, immunisation, or other public health indicators. Reviewing these factors independently makes it difficult to compare counties consistently or identify where planning attention may be most needed.
I wanted to explore whether these independent public datasets could be brought together into a transparent analytical framework that provides greater planning context than any individual source alone. The goal was not to replace established planning methodologies, but to demonstrate how population-adjusted analysis, structured comparison, and documented analytical models can transform fragmented public data into interpretable planning signals that support exploratory analysis and evidence-informed discussion.
Objectives
The project was developed with five primary objectives.
-
Integrate fragmented public health datasets into a unified analytical framework by combining health facility records, county population statistics, and KDHS 2022 indicators within a consistent county-level planning workflow.
-
Support more meaningful county comparison through population-adjusted analysis rather than relying solely on raw facility counts, enabling healthcare access to be interpreted within its demographic context.
-
Develop transparent analytical methodologies for the Planning Priority Index and Health Need Index by documenting their component measures, calculation methods, and interpretation rather than presenting composite scores as opaque outputs.
-
Design an interactive planning application that presents healthcare access, ownership patterns, service availability, and county comparison within a structured interface that supports exploratory planning and evidence-informed discussion.
-
Deliver the platform as a production-quality application by combining public API access, performance optimisation, accessibility standards, and reliable deployment practices suitable for real-world exploration and use.
Approach
I approached this project as an incremental healthcare planning application rather than attempting to solve every planning problem within a single release. Instead of treating the dashboard as the final product, I focused on building a planning application that could grow through successive iterations while maintaining a consistent emphasis on transparent methodology, county-level comparison, and interpretable analytical outputs.
Three principles guided my approach.
1. Prioritise planning context over raw data
I wanted the platform to provide more than a visual inventory of healthcare facilities. That meant integrating health facility records with county population statistics and KDHS 2022 indicators so that healthcare access could be interpreted within its broader demographic and public health context. The resulting analytical workflow supports population-adjusted comparison rather than presenting each dataset independently.
2. Build transparent analytical methodologies
I wanted every analytical model to explain how its outputs were produced rather than present composite scores as opaque results. Population-adjusted access analysis, the Planning Priority Index, and the Health Need Index therefore expose their documented methodologies, component measures, and interpretation so that users can understand how each planning signal is generated.
3. Treat engineering quality as part of the product
I considered engineering quality to be part of the planning experience rather than a separate implementation concern. Public API documentation, performance optimisation, accessibility improvements, export workflows, and production deployment were developed alongside the analytical models so that the platform would be transparent, reusable, and practical to explore.
Together, these principles shaped both the technical implementation and the evolution of the platform, allowing the project to mature from a healthcare facility dashboard into a structured healthcare planning application.
System Design
The system was designed as a layered healthcare planning architecture in which each component performs a distinct responsibility within the overall analytical workflow. Separating data integration, analytical modelling, presentation, and documentation allows each layer to evolve independently while maintaining a transparent and reproducible planning process.
The architecture consists of four logical layers.
1. Data Integration Layer
The data integration layer combines multiple public datasets into a unified county-level analytical model. Health facility records, county population statistics, and KDHS 2022 indicators are normalised, validated, and aligned to create a consistent foundation for planning analysis. This layer ensures that downstream analytical models operate on harmonised data rather than disconnected sources.
2. Analytical Modelling Layer
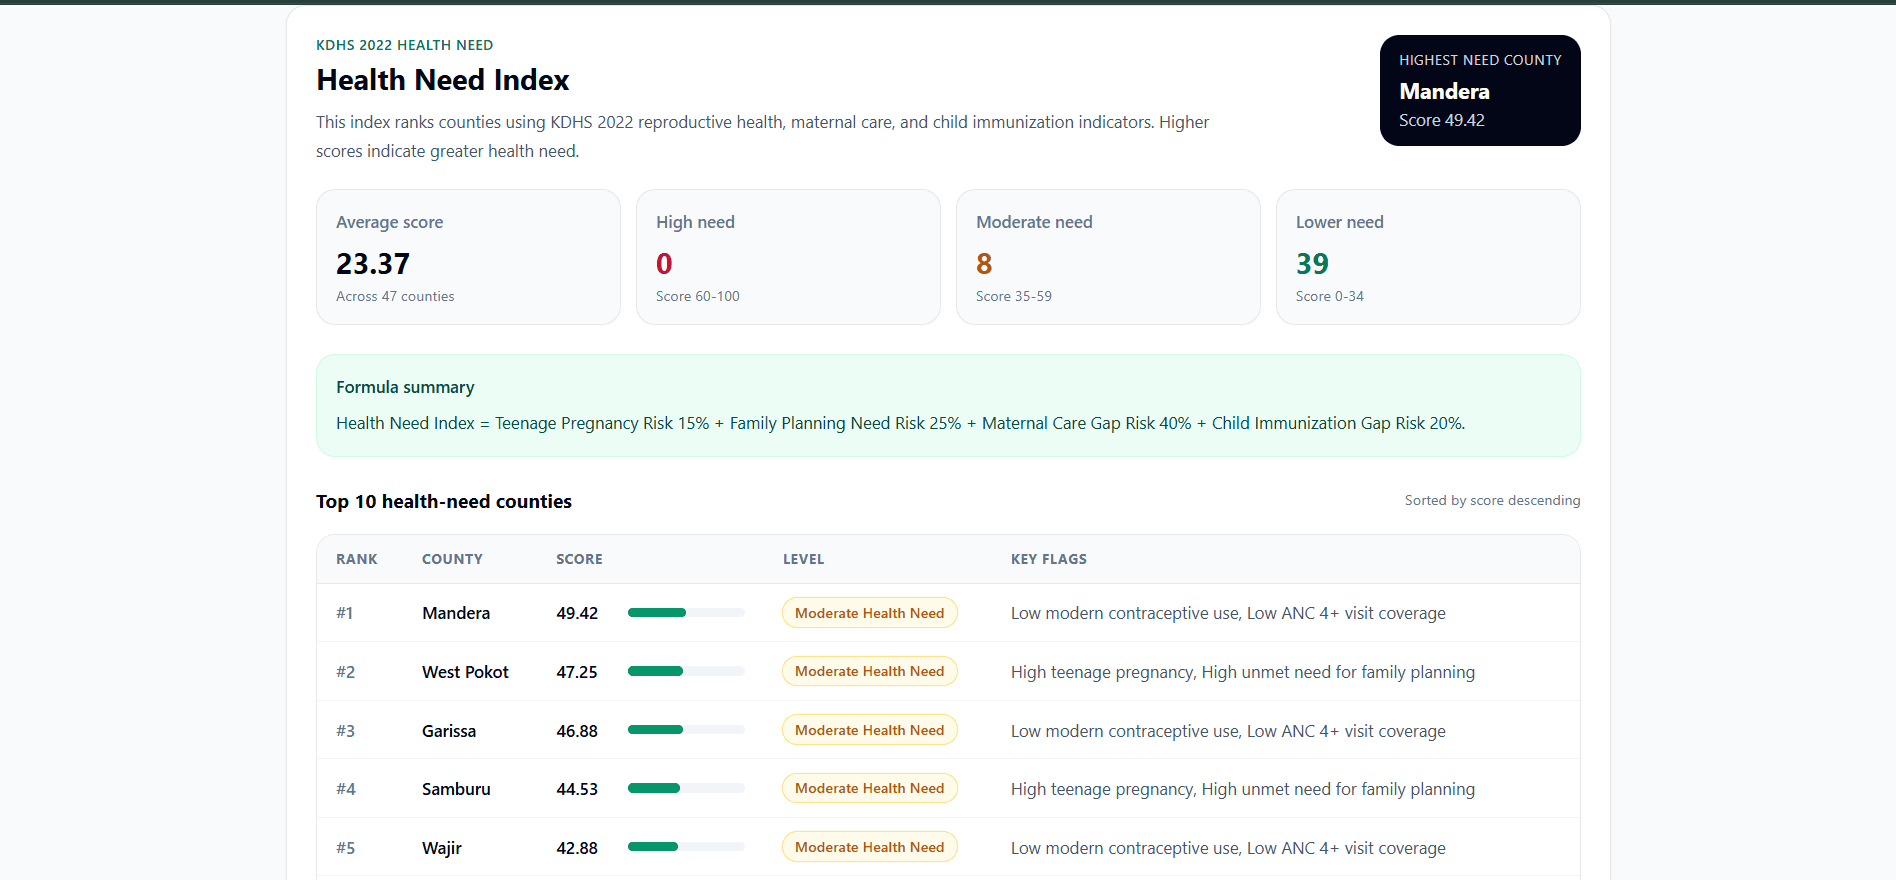
The analytical modelling layer transforms the integrated dataset into interpretable planning indicators. Population-adjusted access analysis, the Planning Priority Index, and the Health Need Index are generated using documented methodologies and reproducible calculations. Rather than producing opaque scores, this layer exposes the analytical logic behind each planning methodology while keeping the underlying calculations transparent and reproducible.
Although each methodology is implemented independently, the indicators are designed to be interpreted together. Population-adjusted access analysis provides infrastructure context, the Planning Priority Index highlights access-related planning priorities, and the Health Need Index estimates underlying health need. Together, these complementary methodologies support more informed county-level comparison while remaining analytically independent.
3. Presentation Layer
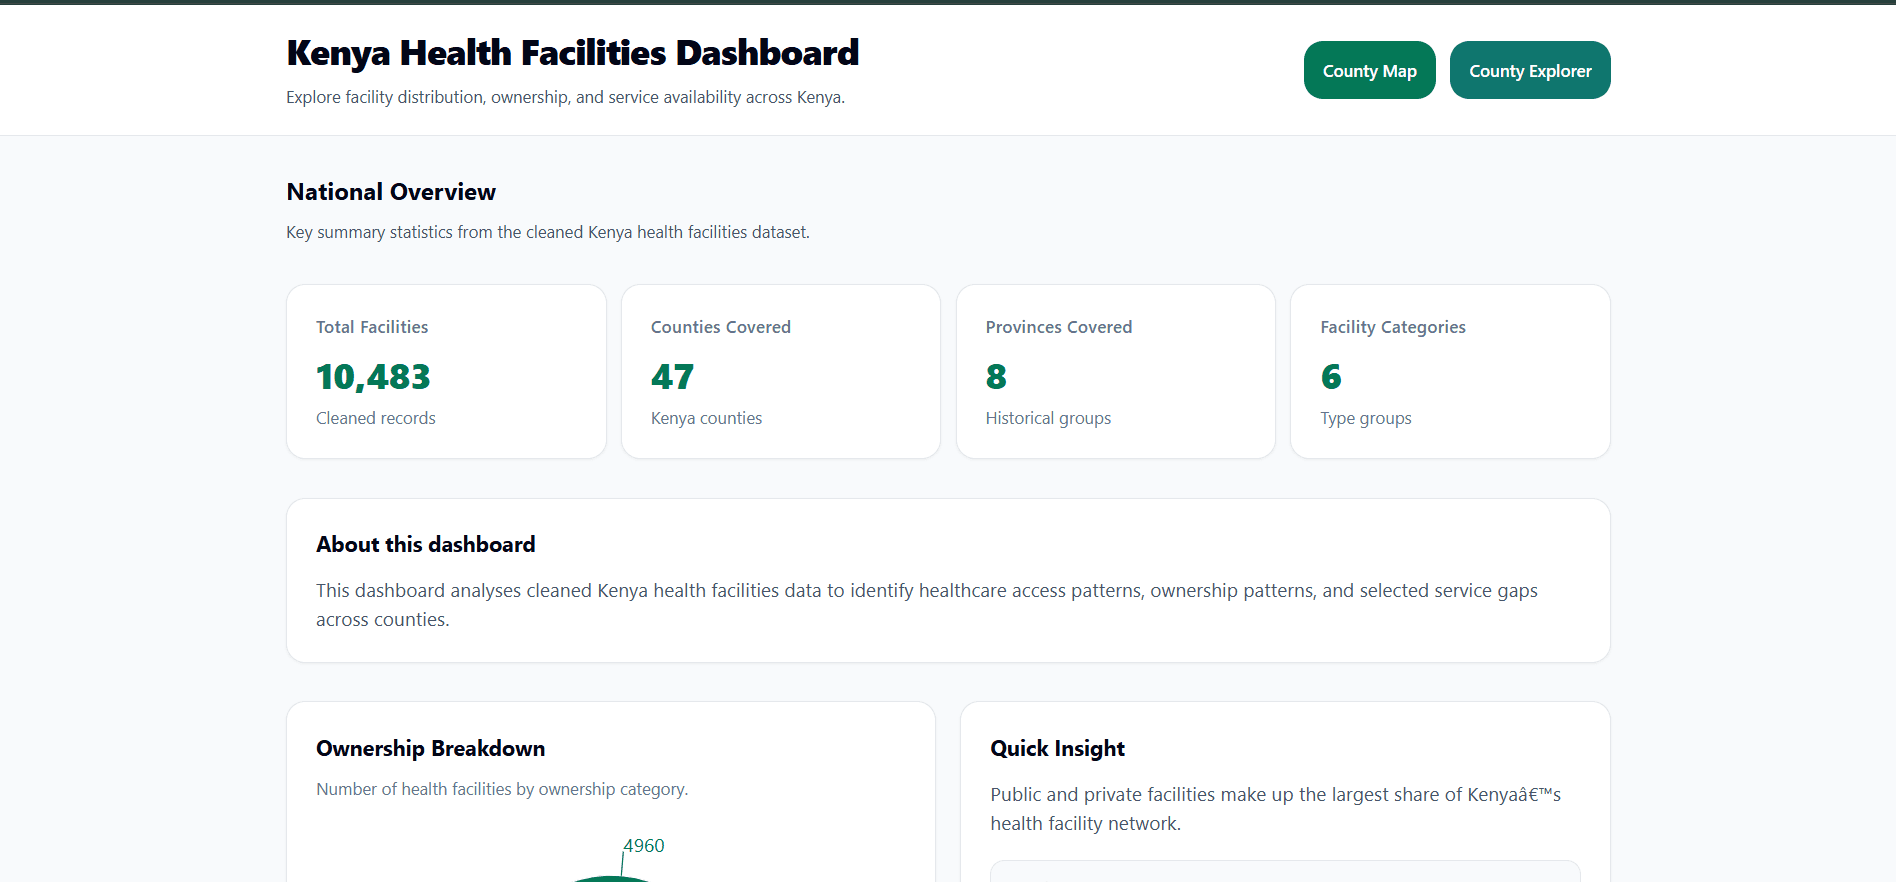
The presentation layer exposes the analytical outputs through an interactive dashboard, county comparison workflows, printable reports, CSV exports, and documented REST API endpoints. Rather than combining the analytical methodologies into a new planning model, this layer presents multiple planning indicators side by side, allowing users to compare healthcare access, ownership patterns, service availability, and health need within a consistent interface.
4. Documentation Layer
The documentation layer connects methodology, implementation, deployment, API documentation, release history, and supporting project artefacts. By documenting both the analytical methodologies and the engineering decisions behind them, this layer helps ensure that planning outputs remain transparent, reproducible, and traceable as the project evolves.
Technical Implementation
The project was implemented as a full-stack healthcare planning application that combines public data integration, analytical methodologies, REST API services, and interactive visualisation into a unified planning workflow. Rather than treating the dashboard as the primary artefact, the implementation was organised so that data processing, analytical methodologies, presentation, and documentation remain clearly separated while producing consistent planning outputs.
The implementation consists of five major components.
1. Data Processing
The data processing layer prepares multiple public datasets for analysis by normalising county names, grouping health facility records, integrating county population statistics, and combining KDHS 2022 indicators into a unified county-level dataset. This preprocessing stage allows analytical methodologies to operate on consistent, validated data despite differences in source structure and naming conventions.
2. Analytical Methodologies
The analytical layer implements several independent planning methodologies, each designed to answer a different planning question rather than producing variations of the same metric.
Population-adjusted access analysis estimates healthcare access relative to county population. The Planning Priority Index combines infrastructure, service availability, ownership distribution, and population context into a transparent prioritisation methodology. The Health Need Index independently estimates county-level health need using KDHS 2022 indicators and does not depend on the outputs of the Planning Priority Index.
Together, these methodologies provide complementary planning signals that support structured county-level analysis while remaining analytically independent.
3. Backend Services
The backend was implemented using FastAPI and exposes documented REST endpoints for healthcare facility data, ownership analysis, population-adjusted access, the Planning Priority Index, the Health Need Index, the Need-Access Gap Index, and CSV export.
To improve operational reliability, the API applies endpoint-specific rate limiting using SlowAPI. Lightweight status endpoints allow up to 120 requests per minute, analytical endpoints allow 60 requests per minute, and resource-intensive CSV export operations are limited to 10 requests per minute. This tiered configuration aligns request limits with endpoint cost rather than applying a single global threshold.
4. Frontend Application
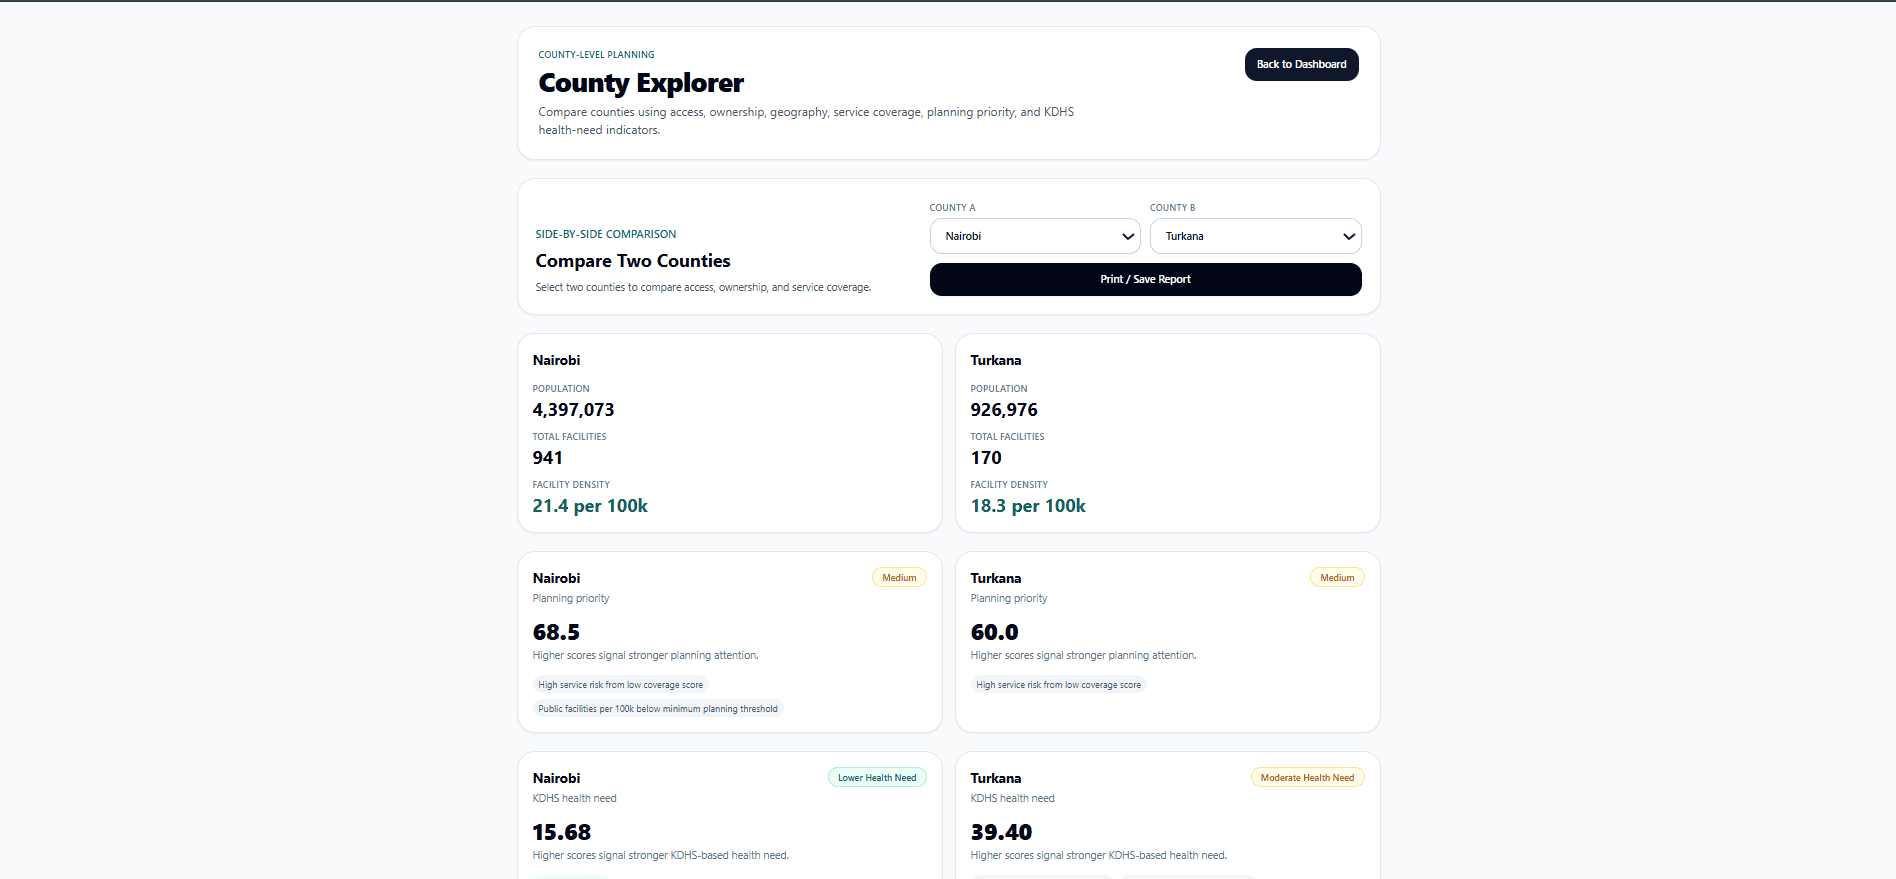
The frontend presents the analytical methodologies through an interactive dashboard that supports national overview, county exploration, side-by-side county comparison, printable reports, downloadable datasets, and publicly documented API access.
Rather than introducing additional analytical models, the interface brings together complementary planning methodologies within a consistent user experience, allowing healthcare access, ownership patterns, service availability, and estimated health need to be reviewed together during county-level analysis.
5. Deployment and Optimisation
The application was deployed using Vercel for the frontend and Render for the backend, with public API documentation generated through FastAPI's OpenAPI interface.
Production optimisation focused on route-level code splitting, lazy loading, deferred API requests, and JavaScript bundle reduction. These improvements reduced the primary dashboard bundle from approximately 435 kB to 48 kB, increasing the mobile PageSpeed Insights performance score from 56 to 95 while maintaining perfect Lighthouse scores for Accessibility, Best Practices, and SEO.
Results
The completed project evolved from an exploratory healthcare facility dashboard into a production-ready healthcare planning application that integrates multiple public datasets into a structured county-level analytical workflow. The final release combines transparent analytical methodologies, interactive planning tools, public API access, and production-quality frontend engineering within a single platform.
Engineering Outcomes
The production release focused on improving performance, accessibility, and deployment quality while preserving the analytical capabilities introduced throughout the project's development.
PageSpeed
95
Mobile PageSpeed Insights
Accessibility
100
Lighthouse accessibility score
Best Practices
100
Lighthouse best practices score
SEO
100
Lighthouse SEO score
Bundle Size
435 → 48 kB
Dashboard JavaScript after optimisation
Production optimisation reduced the primary dashboard JavaScript bundle from approximately 435 kB to 48 kB through route-level code splitting, lazy loading, deferred API requests, and page-level optimisation. These improvements increased the mobile PageSpeed Insights score from 56 to 95 while maintaining perfect Lighthouse scores for Accessibility, Best Practices, and SEO.
Planning Capabilities
By the final production release, the application supported a complete county-level planning workflow built around transparent analytical methodologies and reproducible public datasets.
- Population-adjusted healthcare access analysis
- County Explorer with side-by-side comparison
- Planning Priority Index
- Health Need Index
- Ownership and service availability analysis
- Printable county comparison reports
- Public REST API with documented endpoints
- CSV export for downstream analysis
The production release demonstrates not only the implementation of transparent analytical methodologies but also the engineering discipline required to package them into a performant, accessible, and publicly deployable application. Together, the documented methodologies, public API, deployment architecture, and production-quality frontend establish a strong foundation for future validation, benchmarking, and expansion as additional healthcare datasets become available.
Lessons Learned
This project reinforced that healthcare planning depends as much on context as it does on data. Integrating health facility records, county population statistics, and health indicators required more than combining datasets—it also required consistent county normalisation, transparent assumptions, and careful handling of differences between public data sources. Bringing these datasets together demonstrated that meaningful planning insights emerge from their relationships rather than from any single source.
Developing the Planning Priority Index and Health Need Index also changed how I think about analytical methodologies. Building the calculations was only one part of the challenge. Making their assumptions explicit, documenting how they work, and presenting them in a way that others could understand proved just as important as the calculations themselves. That experience reinforced the value of transparency over complexity when designing analytical systems.
The project also strengthened my appreciation for the relationship between analytical work and product engineering. Public API documentation, performance optimisation, accessibility improvements, deployment, and clear documentation were not simply finishing tasks—they became essential parts of making the analytical methodologies usable, reproducible, and open to scrutiny.
Perhaps the most important lesson emerged while revisiting the project for this case study. Building the application was only part of the work. Explaining the analytical methodologies, verifying architectural decisions against the implementation, and documenting the project's assumptions and limitations reinforced that credibility comes from disciplined implementation as much as from technical capability.
That experience now shapes how I approach healthcare analytics, data-driven product design, and the development of transparent analytical systems. I place greater emphasis on making assumptions explicit, documenting engineering decisions, and ensuring that every important claim can be traced back to evidence within the implementation itself.
What I'd Do Next
If I continued developing this project, I would focus on strengthening the analytical methodologies, expanding the planning framework, and validating the platform against established healthcare planning practice.
The first priority would be completing the Need-Access Gap Intelligence workflow. Although the backend implementation and API endpoint have already been developed, the functionality has not yet been fully integrated into the production planning experience. Completing this work would allow planners to compare healthcare need and healthcare access within a single analytical workflow while preserving the transparency of the existing methodologies.
The second priority would be validating the Planning Priority Index and Health Need Index through sensitivity analysis, comparison with established healthcare planning methodologies, and benchmarking against published research on county-level healthcare priority-setting in Kenya, including studies examining how equity and efficiency considerations influence county planning and budgeting decisions. Rather than introducing additional analytical models, I would first strengthen confidence in the existing methodologies by evaluating how their outputs change under different assumptions and how well they align with recognised planning approaches.
The third priority would be expanding the analytical framework with additional planning dimensions, including healthcare workforce distribution, facility capacity, travel-time accessibility, service utilisation, county health expenditure, and longitudinal trend analysis. These additions would provide a more comprehensive representation of healthcare access while maintaining the project's emphasis on transparent and interpretable analytical methodologies.
Finally, I would package the data processing pipeline, analytical methodologies, public API, and reporting workflow into reusable platform components that could support future healthcare planning projects built on different datasets or deployed in other public health contexts.
Collectively, these improvements would evolve the project from a production-ready healthcare planning application into a broader healthcare planning platform built on transparent methodology, validated analytical models, and reproducible public health data workflows.